We can feel vibrations of all types of rotating equipment. However we do not know what causes the vibrations in the systems. Vibration data taken from transducers (displacement, velocity, and acceleration) display vibration magnitude versus time, which is known as time domain. Time domain contains complex waveforms because vibrations from different sources are captured by transducers. Vibrations can be caused one of the followings or combinations of the followings: unbalanced mass, hydrodynamics forces, coupling misalignment, loose footing, bearing damage, gear mismatch/damage, and many more. Complex waveforms are usually observed in washing machines, fans, angle grinders, optical disk drive, boat propellers, driveshafts, compressors, internal combustion engines, centrifuges, pumps, etc.
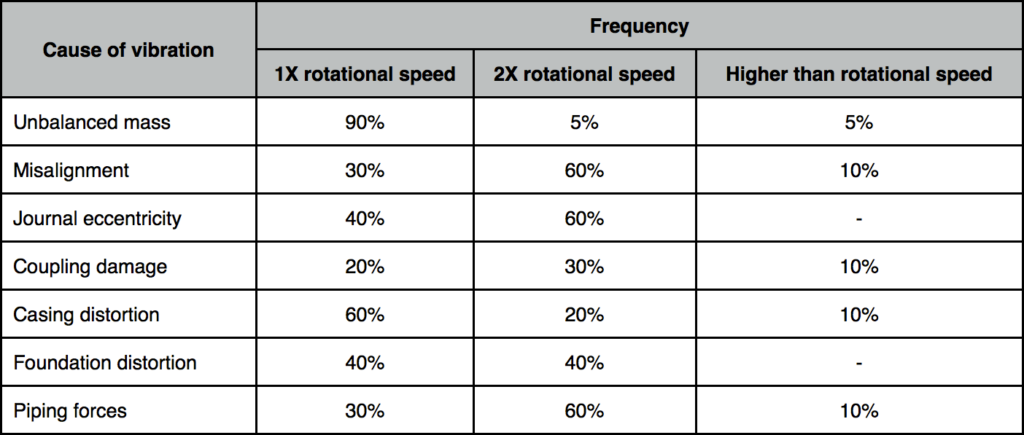
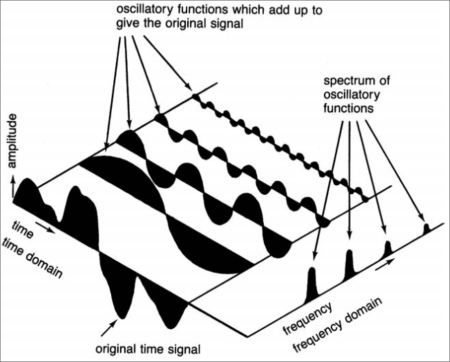
The Fourier transform is very powerful tool for extracting information from complex waveforms that are not directly apparent from the time domain alone. The Fourier transform decomposes the complex time domain waveform into several sinusoidal waveforms that oscillate at different frequencies. As example of signal decomposition into the frequency domain appears in the Figure. The strength of the signals (amplitudes in the spectrum) determines the dominant frequencies involved in creating the observed vibration. The Table shows some typical causes of vibration associated with particular frequencies. Most notable is the influence of unbalanced mass at 1X rotational speed.
[Source: Boyce, M, Gas Turbine Engineering Handbook (3rd edition), Houston: Elsevier, 2006]